Saturday, October 27, 2012

Overpopulation of Las Vegas


Problem Narrative

With advancements in technology and medicine, the problem of overpopulation has become a reality throughout the world.  This has even become true in the United States.  One such location is Las Vegas, NV.  The population in Las Vegas has increased from under 200,000 to nearly 1,600,000 in just the forty years between 1960 and 2000 (see graph below).    While nature used to be harsher on the human population in terms of survival, it seems humanity is slowly exacting its revenge by creating harsher conditions for nature to achieve its purpose.  As a result, a different set of conditions have arisen to make it hard for the human race to survive.


Behavior Over Time

Some variables in the problem of Las Vegas's overpopulation include the tourism industry, living rates, unemployment rates, and availability of water, among others.  This issue has far-reaching contributors and impacts.

Relevance of a Systems Viewpoint

The issue of overpopulation can be observed very effectively from a systems viewpoint.  First, it is clear that population growth covers a long time horizon as the human population has fluctuated over an extremely long period of time, and Las Vegas's population has greatly increased over the last fifty years.  Second, many actors have an impact on population growth, and therefore, overpopulation.  Some of these actors include tourists, entertainment industry workers, residents, and employers.  Third, policy resistance and policy debates seem to go hand-in-hand on this topic.  Housing prices have gone down the drain in the last few years but that has not deterred people from moving to Las Vegas.  Despite officials' calls for limited water, residents and tourists continue to overuse the resources of the area.  Lastly, influx and outflow of tourists, residents, and employees show evidence of feedback dynamics.  The influx of tourists is also an outflow when their vacations are finished - demonstrating a balancing feedback and the lowered cost of living lead to more people moving to Las Vegas and lead to a reinforcing feedback.

Study Objective and Questions to be Addressed

For this study, the causes of overpopulation in Las Vegas and how to counteract its negative effects (and how that will help policymakers find solutions) will be addressed.  Some of the questions that will be asked and hopefully answered will include the following: Is there one factor that has had the most impact on population growth in this area?  Are there many policies that have attempted to address this problem or has the problem even been observed and noted?  What can be done to help reduce this problem?  Hopefully, creating and using systems dynamics, causal loop diagrams, and simulations will help us discover the answers to these questions.

Dynamic Hypothesis

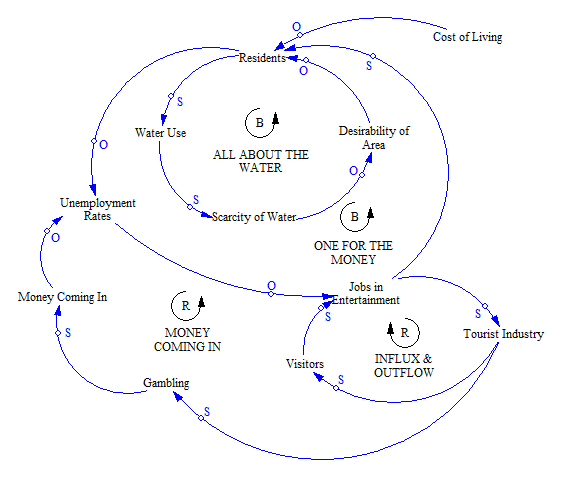
The first reason for some of Vegas's overpopulation problems lie in its dependence on the tourist industry.  The following loop demonstrates how tourism plays a role in the city's growth and sustenance.
As can be seen in the above CLD, as the tourist industry brings in more customers, it creates more jobs for residents.  The tourism industry as a booming business and the jobs that business create are intended consequences in this system.  No town wants to go extinct.  These added jobs then invite more people to move to Vegas, as shown in the following diagrams.


As more residents move to the Las Vegas area, water availability goes down.  This would invite fewer people from moving here.  However, there would likely be a delay between scarcity and desirability owing to the fact that many residents might not realize the scarcity right away.  The scarcity of water in the area is an unintended consequence of the tourism industry that leads to more residents in the Vegas area.


Now, with the first two loops and a new loop added in, we can see that many of the variables in this diagram have something to do with the residents of the area.  An increase in residents decreases the amount of water and the amount of jobs in the area.  However, with more people in the area, the tourism industry is booming and more jobs are created - leading to more people seeing their opportunity and moving.  The rise in unemployment is another unintended consequence in this system.


 Now, finally, we have the full causal loop diagram for this issue, with at least the most visible factors that are connected to overpopulation.  This last loop is less necessary, but as gambling is a very large part of the tourism industry in Las Vegas, I felt it needed to be included.  The money coming in from the gambling business is an intended consequence.  Also in this final diagram is the cost of living variable as exogenous.  The other variables in the diagram did not seem to particularly affect the cost of living, but the cost of living affects how many people have a desire to move to Las Vegas.


Sunday, October 21, 2012

Rent Controls

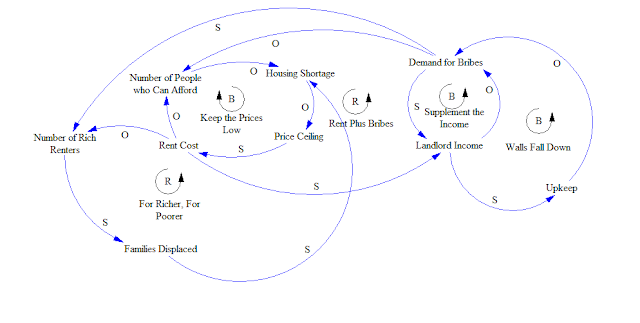
This is what I have, but I'm positive I've missed something.  I only have 9 variables and 5 loops.

Saturday, October 13, 2012

Overpopulation

Problem Narrative

With advancements in technology and medicine, the problem of overpopulation has become a reality.  The death rate has decreased in many parts of the world and the survival rate has conversely increased.  As the world becomes more populated, the earth is reaching its limit in being able to sustain the populations on it.  Food and water shortages become a problem.  Farmland becomes infertile because it is overworked.  There is no room for more people to live as they are being born and there is even less room for burial as they die.  While nature used to be harsher on the human population in terms of survival, it seems humanity is slowly exacting its revenge by creating harsher conditions for nature to achieve its purpose.  As a result, a different set of conditions have arisen to make it hard for the human race to survive.

Behavior Over Time

Some variables in the problem of overpopulation include the basics of birth rate, survival rate, and death rate.  Some others include population density, availability of cropland, and availability of water, among others.  This issue has far-reaching contributors and impacts.

Birth rate:


This graph shows that while the crude birth rate is decreasing slightly over this ten-year span, it is more likely that women are able to (and do) have children over a wider range of ages than used to happen.  This is because of advancements in fertility drugs and treatments.


This graph shows the world fertility rates.  The areas where death rates are probably higher most likely also correspond to the areas where the fertility rates are higher.

Survival rate:

As can be seen in this graph, even in just the last 110 years, the overall survival rate has greatly increased and humans are living longer as well.

The graph below compares birth rate to death rate over a period of 60 years.  While the birth rate is declining, so is the death rate.  Also, the death rate is clearly much lower than the birth rate - resulting in more births than deaths.


Here is also a graph that has the population growth from 1950 as well as projections for continued growth until 2050.


Population break-down for the world:


These are just a few of the variables and how they seem to change over time.

Relevance of a Systems Viewpoint

The issue of overpopulation can be observed very effectively from a systems viewpoint.  First, it is clear that population growth covers a long time horizon as the world's human population has fluctuated over an extremely long period of time.  Second, many factors (or actors) have an impact on population growth, and therefore, overpopulation.  Some of these actors include advancements in medicine, better industrialization that takes some of the strain off workers, structural improvements in housing, even the development of structured government and the use of treaties among nations.  Third, policy resistance and policy debates seem to go hand-in-hand on this topic.  There has been evidence of policy resistance in China where the government regulated the number of children couples were allowed to have.  Parents found ways to get around the law or simply got rid of girl babies.  Now, young men who are at the age where they should be thinking about getting married and having children do not have enough young women to be their spouses.  Because of these obvious issues (there are probably many more issues that run deeper), any country that might be considering limiting their population in this way would have some serious consequences to observe. Lastly, the birth, death, and survival rates alone show evidence of feedback dynamics.  The lowered birth rate would lead to more of a balancing feedback and the lowered death rates and increased survival rates lead to a reinforcing feedback.

Study Objective and Questions to be Addressed

For this study, the causes of overpopulation and how to counteract its negative effects (and how that will help policymakers find solutions) will be addressed.  Some of the questions that will be asked and hopefully answered will include the following: Is there one factor that has had the most impact on population growth?  Are there many policies that have attempted to address this problem?  What can be done to help reduce this problem around the world?  Hopefully, creating and using systems dynamics, causal loop diagrams, and simulations will help us discover the answers to these questions.

Thursday, September 27, 2012

Revised

I actually found 8 loops. 


Delays: I think there should be a delay somewhere between Altitude and Throttle Setting because human reaction is involved.  I think it would go between Goal Descent Rate and Throttle Setting. However, this wouldn't be a huge delay because of the short period of time we're talking about with rocket launching. I think the rest of the variables feed on the others (and are machinery-based), making things instantaneous.

I believe, based on the variables the human operator would be focused on at each point of the rocket flight, the outer parts of the CLD would be the focus at the beginning of the process and the inner parts of the CLD would be the focus at the end (Descent Rate, Gravity-related variables, Air Density, Air Resistance, and Altitude).  Also, the gravity, air density, and air resistance wouldn't come as much into effect until the rocket closed in on the ground.  Remaining fuel would be closely observed for the entire flight. 

Below is the table that outlines the variables and progression of each of the loops.  As you can see, because I didn't realize what the throttle and the thrust meant (ie. increasing the throttle and the thrust actually means the rocket slows down), two of my loops should actually a different type of loop. 

Loop ID (i.e. R1, B1, etc)
Loop name
Description of the role that the loop plays in the flight of the rocket. That is, “tell the story” about each loop.
B1
Force of Air
The Altitude (decrease) has an effect on the Air Density (increase) which then impacts Air Resistance (increase) and then the Descent Rate (decrease) which leads back to Altitude (increase – it’s not really going back up in the air, but that’s the closest approximation of what it does)
B2
Gravity Pulls
The Altitude (decrease) leads to a difference in Air Density (increase) which changes the Acceleration due to Gravity (decrease) and changes the Descent Rate (decrease) and back to Altitude (increase). 
R1
Close and Closer
The Altitude (decrease) leads to a difference in Force of Gravity (increase) which changes the Acceleration due to Gravity (increase) and changes the Descent Rate (increase) and back to Altitude (more decrease). 
R2
Fuel Running Down
Remaining Fuel (decrease) leads to a change in the Rocket’s Mass (decrease) which then leads to a change in the effect Gravity has on the Rocket (decrease) and thereby, affecting the Acceleration due to Gravity (decrease).  This changes the Descent Rate (decrease) and the change in Descent Rate changes the Altitude (increase – really this is the rate the altitude is changing).  As the Altitude changes, the Goal Descent Rate also changes (increase) and affects the Throttle Setting (decrease) and therefore the Fuel Burn Rate (decrease) leading to a change in the Remaining Fuel (increase – actually a rate again, the fuel is not actually increasing).  SO this is actually a balancing reaction.  I didn’t understand what the engines (and therefore the throttle) were supposed to be doing until today in class.  This should really be B7, I think.
B3
Descending
As the Altitude (decrease) changes, the Goal Descent Rate also changes (decrease) and changes the Throttle Setting (increase) and the Fuel Burn Rate (increase).  As the Fuel Burn Rate changes, the Thrust (increase) and Upward Acceleration (increase) also change.  This leads to a change in Descent Rate (decrease) and a subsequent change in the Altitude (increase). 
B4
Thrusters on Full
As the rocket’s fuel changes – Remaining Fuel (decrease) – the Goal Descent Rate (decrease) changes and leads to a desire to change the Throttle Setting (increase) and the Fuel Burn Rate (increase) also changes.  This leads again to a change in the Remaining Fuel (decrease).  So, this should be a reinforcing loop instead – again, my idea about the throttle was confused. R3 is what it should be called.
B5
Descent Resistance
As the Descent Rate (increase) changes, the Force of Air Resistance on the Rocket (increase) also changes.  This leads again to a change in the Descent Rate (decrease). 
B6
Fuel Up Fuel Down
The Remaining Fuel decreases as the rocket continues its descent and that decreases the Rocket’s Mass.  As the mass changes, so does the Upward Acceleration but it increases.  This decreases the Descent Rate and “increases” the Altitude and the Goal Descent Rate.  As the Goal Descent Rate increases, the operator wants to decrease the Throttle Setting.  Decreasing the Throttle Setting also decreases the Fuel Burn Rate.  This “increases” the Remaining Fuel.  That progression makes this a balancing loop.


Rocket Man CLD

Here is what I have but it still doesn't really feel right.


Sunday, September 23, 2012

Coastal Erosion and Jetties

Along the East Coast of the US, especially in the Outer Banks and Intracoastal Waterway areas, there are problems with coastal erosion.  The currents along this middle to southern section of the East Coast can be very strong.  The implications of this are the gradual loss of beach area in some locations and many deposits of sand onto other beach areas. 

In this commercial age, the diminishing sand and the encroaching waves would mean the loss of beachfront property and business in the tourism economy.  Business owners and property owners placed pressure on governmental organizations to find a solution to the erosion problem.  What they didn't realize is that the solutions they could think of would either cause new problems or would not permanently fix the current problem.

One of the ideas the government had was to relocate the already relocated sand.  By dredging up sand that was deposited on some beaches and taking it back to the eroded beaches, governmental organizations figured this would at least help the problem.  This process is expensive and has to be repeated often.  However, that's not the main focus here.

Officials decided to build jetties.  The purpose of the jetties, and the assumption behind them, was to block the erosion of the sand.  The whole premise is that even if the sand is eroded down current, it will be stopped by the man made jetty jutting out into the current.  This does make beaches an interesting shape because it is not actually stopping erosion in the first place, it is merely preventing the sand on the beach from getting very far. 

What individuals failed to realize (or didn't put much store in) was that by altering the shape of the coastline, they were also altering the flow of the coastal currents.  The currents are not going to stop just because something is in their way.  Instead, the currents then flow around the jetty, and more sand is eroded from the opposite (down current) side of the jetty.  As a result, a new jetty had to be built to prevent the erosion of the down current beach.  This, as is probably obvious, is a continuing cycle of erosion and erosion prevention. 

The mental model of the officials and others in the community was that by placing something in the flow of the current, the erosion from the beaches would be stopped.  This mental model was insufficient because it failed to take into account where the currents would go after they "ran" into the jetties.  Because nature doesn't necessarily move tremendously fast, the new coastal erosion was probably a delay in the real world model.  As a result, for awhile the mental model of these individuals was confirmed when the sand from the beaches was stopped at the jetties.  By the time the deficiency in their thinking was realized, it would have been too late to change the plan.  Thus, more and more jetties built.


I had this idea from multiple classes in undergraduate work.  I wasn't sure where to cite sources as a result.  It's all what I remember from class.  I can thank the James Madison University Department of Geology and Environmental Science.
 

Sunday, September 9, 2012

Here are some graphs I found on air and stream pollution:

Air pollution in America over time:


http://english.people.com.cn/mediafile/200912/02/P200912021515392118984617.png

Ocean pollution:


http://waterstse.files.wordpress.com/2011/04/graph_ocean-pollutants1.jpg

Here is a chart that has all the tasks we use water for in our homes - many ways for pollutants to enter the water just from our usage:


http://academic.evergreen.edu/g/grossmaz/ABRASHNM/IMAGES/piegraphs_files/conservation_graphs_files/with.gif

It was hard to find a line graph for water pollution.  I found the following graph pertaining to London's water quality for 1990 through 2008.


http://www.environment-agency.gov.uk/static/images/Research/Figure-3-water-quality.jpg

Human Impacts on Forests

One problem that interests me at this point is the issue of deforestation and the effects it has on the environment.  With greater increases in population, cities grow and the formerly forest environments are no more.  With the decrease in tree populations and overall vegetation, air pollution has the ability to increase even more.  The low amount of concern society seems to have about this issue is alarming.  It is well established that trees and other plants help animals get the oxygen they need.  This includes us, as humans.  The interesting thing is that humans are both the only animals who can understand and observe this fact and the only animals that have a direct influence on the destruction of these resources.  Tree planting programs are starting to be instituted in more places, but cities are also growing and encroaching on as yet unblemished forests.  A variable that would be interesting to observe but would probably be very difficult to quantify accurately is human impacts on forests.  Over time, this has evolved from simply cutting down forests to dumping trash and releasing toxins into the air as well as water sources.  Even the forests that have not been touched by human consumption are affected by the second-hand touch of humanity: polluted streams and air. 

I guess a good variable would be pollution growth - since most of this comes from human interactions with the environment.  The graphs for this sort of thing would probably show an exponentially increasing curve.  (Okay, I'm not sure about exponentially because those curves tend to approach zero, but it would likely look something like that.  The pollution in our air and water is continually increasing because of the waste we create and the exhaust and smoke we release into the air.  I think there would be a steadily increasing trend even into the future, because while more and more people are becoming concerned with the state of the environment, it is difficult to get the entire world onto the same page with reforms that would most likely limit the convenience of day-to-day life.  Today's society is reliant on instant gratification; instituting new transportation and waste management policies would have huge political and societal ramifications.  The beginning of the increase in pollution would be seen around the time of the Industrial Revolution and as more and more advancements are made in industry and technology, those pollution numbers just keep going up.

The parts of the system would include acres of forests and volume of streams (are there kiloliters? I'm not sure how to measure the streams) that are intact and unpolluted; emissions by vehicles and industry; the average waste produced by humans per year; how much clean-up is done every year (so that would be an opposite relationship probably); public opinion for conservation; new policies; and new policies would probably lead to more creative ways of creating pollution.  I think I might be missing some parts, but those were the ones I could readily describe.  Are we going to draw causal loops of our systems?  In this system, as the emissions increase, the areas of unpolluted forests and streams would decrease.  There would also be an opposite relationship between unpolluted area and waste.  As emissions and waste increase, so would public opinion for conservation increase - leading to new policies.  Then would come in the evasion of the new laws and policies.